

- XLM (XLM) price prediction highlights the sideways volatile range-bound market
- XLM token is down 0.61% in the last 24 hours.
- XLM (XLM) has recorded Year-to-date growth of 38.40%.
Stellar(XLM) price prediction highlights the sideways market movement which began after recovering from a sharp decline in 2022. The market recovered from its swing low of $0.0719 to the resistance of $0.1148, which was a jump of 50%. Since then, XLM fell to the support and recovered from the opposition.
When writing, the XLM crypto is trading at $0.0980. The 24-hour volume witnessed a fall of 19.23%. The overall market cap for XLM tokens is $2,656,522,634.
Can Stellar Sustain its Bullish Recovery?

Source: XLM/USDT 1D by TradingView
XLM’s (XLM) price prediction unveils the bullish price recovery from the critical support area to the resistance of $0.1184. This swing was a 50% move. It was followed by a correction of 15% to its current market price. The volume candle shows a significant increase in buying.
Meanwhile, the XLM token trades close to the 200, 9, and 15 EMAs. All three EMAs are flat, which establishes a sideways market movement. The recent market moves have captured the interest of swing traders who like to trade in a set range. The volatility provided room for decent gains.
Will the Market Break Resistance and Continue Up?
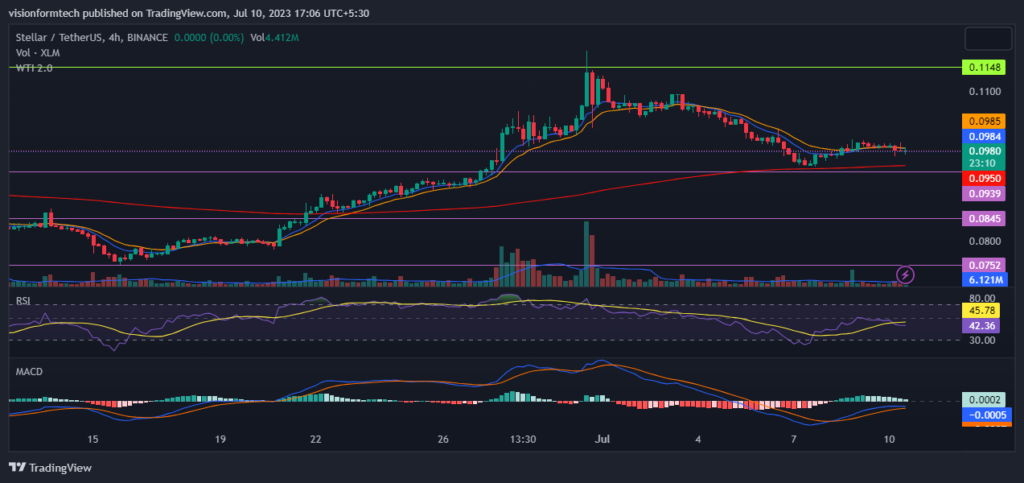
Source: XLM/USDT 4-hour chart by TradingView.
The 4-hour chart displays a market structure of higher highs. It concludes that the market is in an uptrend in the short term. The XLM price is getting corrected after it failed to break the resistance. The price stays above EMA, which is a bullish sign. The recent correction has taken away the momentum from the market.
The price has local support of $0.0939, which the bulls will try to defend. The market movement makes it unpredictable as the prices trade between support and resistance. A clear breakout of the levels will develop a direction. The market is volatile, and investors with less risk appetite should stay away.
RSI: The RSI indicator is currently at 43.11. It indicates that the market is bearish to sideways. The market may continue to move down until the RSI stays below 50.
MACD: MACD made a bullish crossover while the indicator moved close to the 0 line. It means that the market’s direction could be more apparent as the signal and MACD lines move adjacently. The histogram shows a lack of momentum.
200 EMA: On the 4-hour chart, the price is trading close to 200 EMA. It is a sign of a sideways market. The market will establish a clear trend when the price moves away from the EMA.
Conclusion:
Stellar(XLM) price prediction highlights the sideways market movement which began after recovering from a sharp decline in 2022. The recent bullish volatility has invited many new investors. Although, this uptrend is still being determined once it breaks the resistance. Until then, XMR crypto is expected to move sideways, and prices may come down to test lower levels. It would be wise to wait for a breakout to consider investing.
Technical Levels
- The nearest support level: $0.0930
- The closest resistance level: $0.1148
Disclaimer:
The views and opinions stated by the author, or any people named in this article, are for informational purposes only and do not establish financial, investment, or other advice. Investing in or trading crypto assets comes with a risk of financial loss.


 price prediction highlights the sideways market movement which began after recovering from a sharp decline in 2022.)