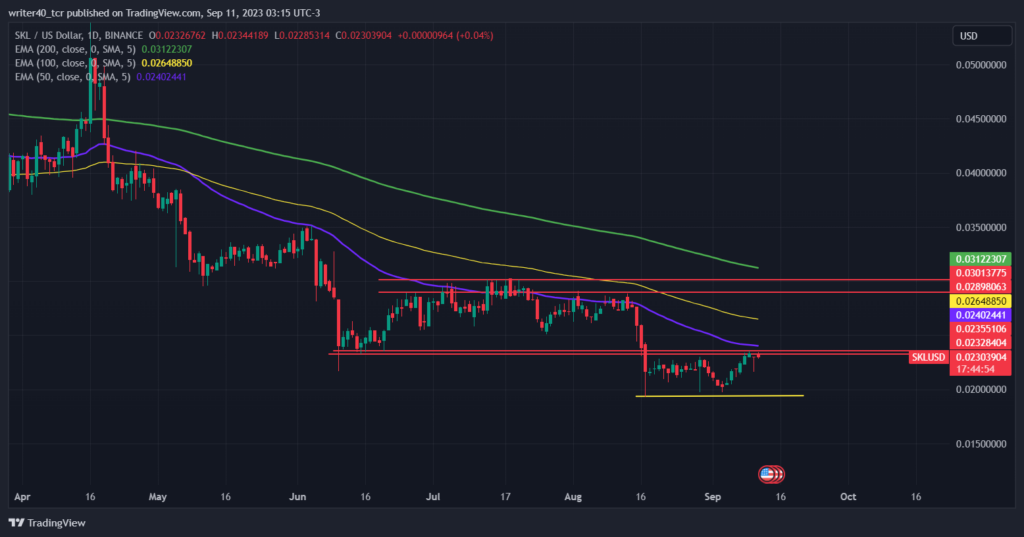
- SKL IS TRADING VERY CLOSE TO 52 WEEK LOW LEVEL i.e 0.01929.
- SKL SOARED 13% THIS WEEK INDICATES BUYING AT LOWER LEVELS.
- SKALE IS DOWN BY ABOUT 68% FROM THE YEAR HIGH AND ABOUT 98% DOWN FROM ALL TIME HIGH.
CURRENT MARKET PRICE OF SKALE – $0.023
MARKET CAPITAL OF SKALE – $ 109.062 M
SKL price has eroded 98% of its gain from highs indicating that the price is currently in a very strong bearish grip and the bearish momentum seems not to be ending soon.
Skale in the previous month tried to break the lower levels as the price declined by more than 33% in 5 days i.e between 13 august to 17 august where the selling halted on 17 aug , but the price was not able to sustain the downward momentum as the fresh selling was absorbed by the buyers .
Skl is trading in a tight range of $ 0.0232 on upside and $ 0.0193 on downside which is a very small range and both buyers and sellers are trying to dominate the other party but till now it is a 50-50 battle favoring none.
SKl price is facing a rejection from 50 and 100 EMAs and the slope of EMAs are downward so until and unless the price is able to cross the EMAs comfortably the price will feel pressure on every rise.
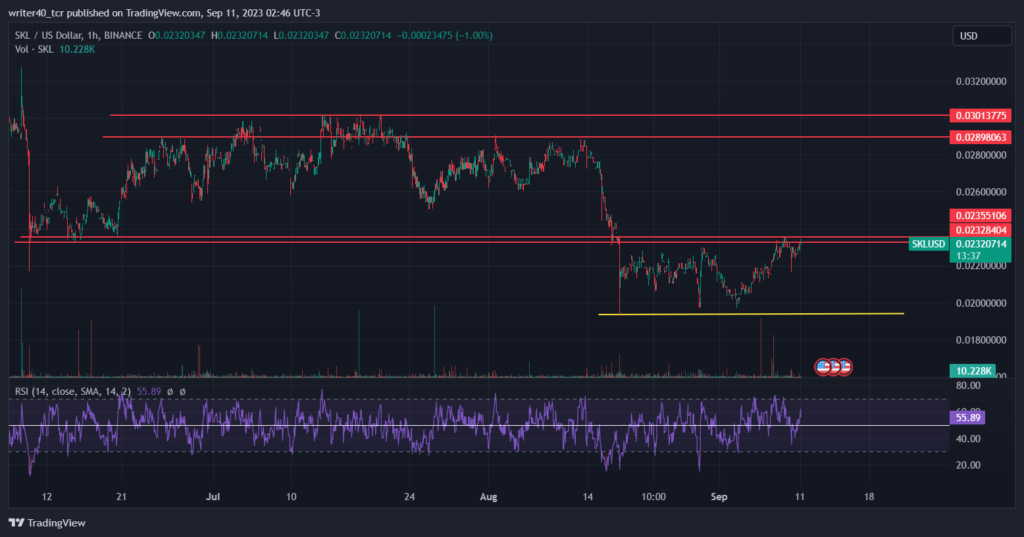
Apart from the EMAs the volume is also flat and there is no surprise is visible on volume profile which means the crypto traders are still indecisive over the future direction of this crypto.

Skale price when breaks the level $ 0.0230 on upside then it can try to trap the short sellers and price can witness the short covering rally towards the upper resistance levels as mentioned above in the chart i.e $ 0.0 289 and 0.0301.
Skale price is showing some sort of strength near the resistance level it means buyers are a little aggressive over the sellers and if the price is able to sustain above the EMAs we can witness some good upside.
If we closely watch the volumes then we can observe that the volume ( 229 k ) is way below than the 10 day average of 1.29 M near the resistance levels which means that at resistance the sellers are not present aggressively.
The above fact can be confirmed by the RSI as the RSI is currently placed above 50 which is a sign of positive momentum shifting, the only matter of concern is the liquidity as the price is looking very illiquid on 1 hour time frame.
CONCLUSION :-
As the price is near to the resistance levels and the volumes are still flat so it can be a positive sign for the Skale although the overall trend of this crypto is down and recently it is trading flat we should wait for the price able to cross EMAs.
For the short term, price is trying to break the resistance level and 3-4 important aspects are supporting the above statement the price can see some short covering rally towards the 2nd resistance levels mentioned above.
TECHNICAL LEVEL :-
RESISTANCE – $ 0.0232 AND $ 0.0289
SUPPORT – $ 0 .0195
DISCLAIMER-
The views and opinions stated by the author, or any people named in this article, are for informational purposes only and do not establish financial, investment, or other advice. Investing in or trading crypto assets comes with a risk of financial loss.


