- Carnival Cruise Line is a British-American cruise operator company.
- It was founded in 1972 by Ted Arison. The stock is listed on the New York Stock Exchange (NYSE) and the London Stock Exchange (LSE).
- In this article, we will analyze the CCL stock.
The CCL stock is in a sideways position. The stock was in an uptrend before January 17, but the stock has been in a downtrend after that day. It is not good for a long-term investment in today’s scenario.
This stock may continue its downtrend as it can make another resistance point on the downtrend line. If it gives any breakout, then there is a chance of recovery. It is not good for investment until a breakout occurs.
Moreover, we will analyze the stock to gain some information through technical analysis in yearly, monthly, weekly, and daily time frames.
Technical Analysis of the CCL Stock (Yearly)
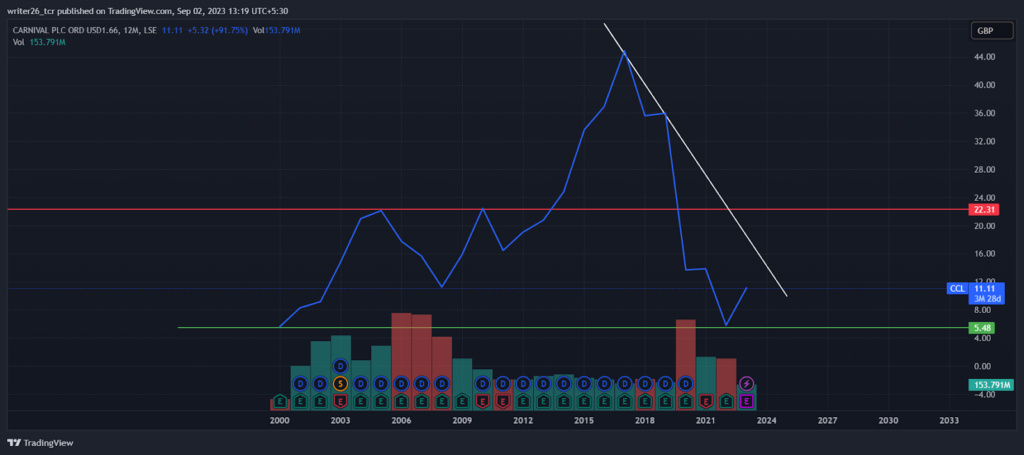
The stock is in a sideways position in the yearly time frame analysis. It is in a downtrend near the current market price. The stock is not suitable for a long-term investment as the chance of returns is less. This share may continue its downtrend in the future if there is no breakout.
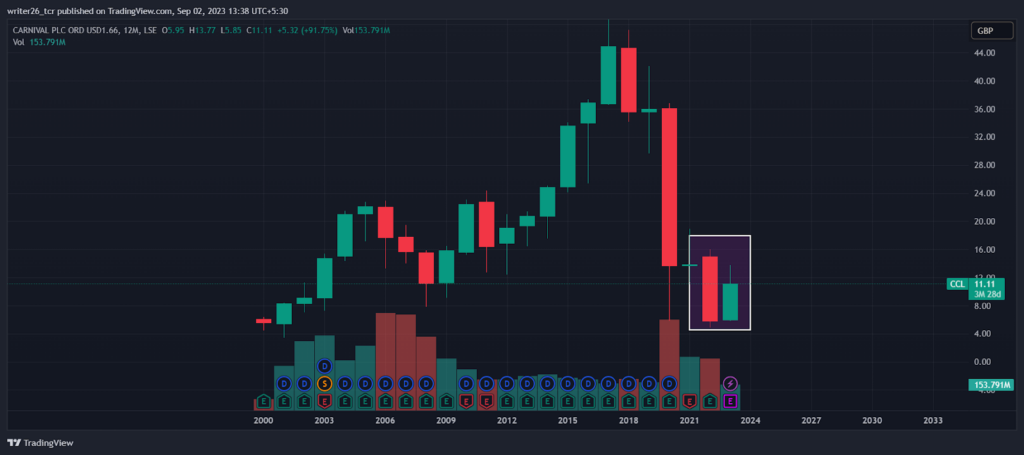
The pattern in the rectangle represents bullish harami, indicating a reversal in the bear trend. It gives an indication that the stock may give an upward movement in the future. It can break the downtrend to give a breakout.
Technical Analysis of the CCL Stock (Monthly)
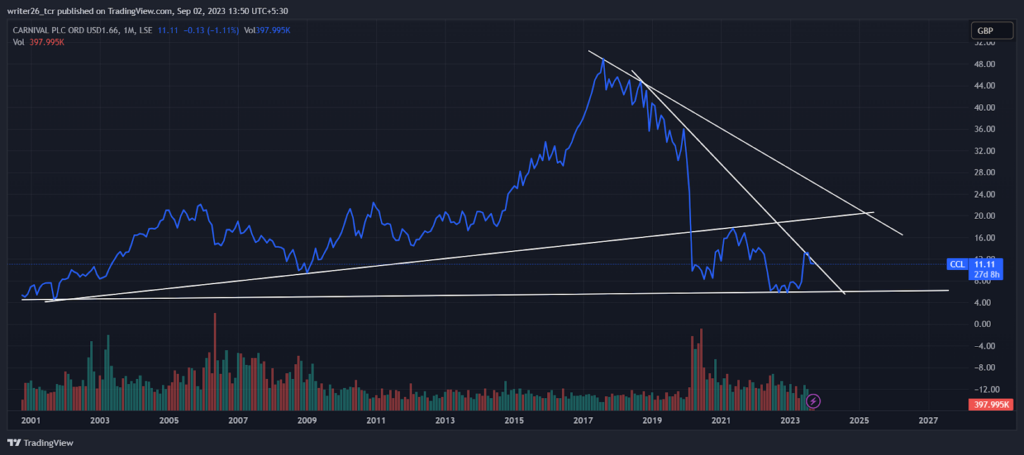
In the monthly time frame, the stock is in a sideways position. Near the current market price, it is in a downtrend from 1st August 2017. It may continue the downtrend by making another resistance point on the downtrend line in the future. So, the CCL stock is not good for monthly investment. This stock came down to an all-time low price from where it started its journey.
Technical Analysis of the CCL Stock (Weekly)
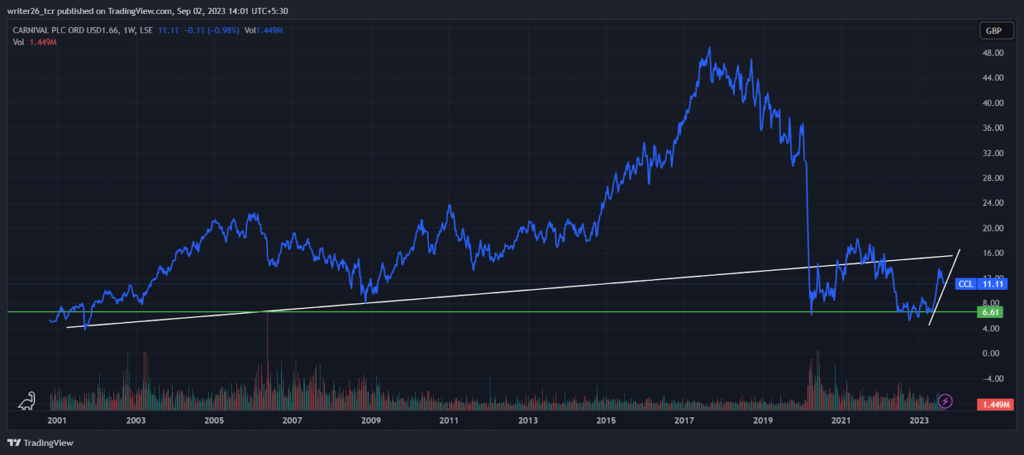
In a weekly time frame, the stock near the current market formed an uptrend. So, the chances of an upward movement are there. The CCL stock can take support from the trend line and go in the upward direction. It is a good pick for weekly or swing trading, but the stock needs to break the resistance level to continue its upward movement. It won’t be easy because the stock is in a downtrend and the chances of a breakout are low.
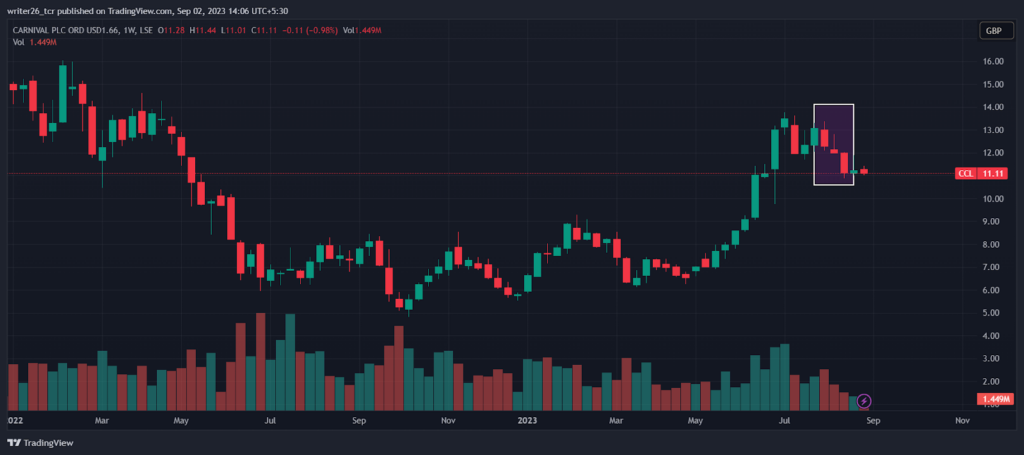
The pattern in the rectangle represents three black crows, which indicate the stock may continue its downtrend. The results are showing the same as the stock is continuing its downtrend. So, the candlestick pattern shows that the stock may continue its down movement in the future.
Technical Analysis of the CCL Stock (Daily)
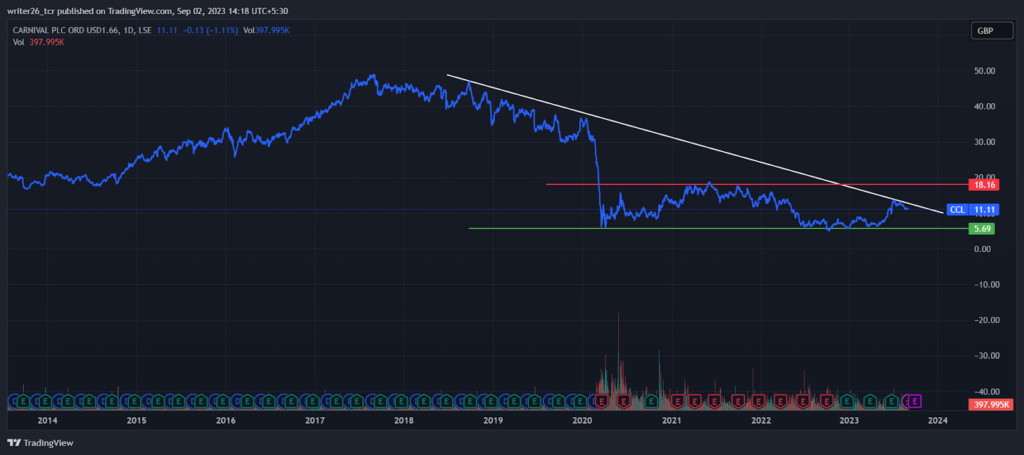
In the daily time frame, the stock is in a downtrend, but it has been in a sideways position since 2020. It has been traded in the range between the support level and the resistance level. So, the stock may again start a downward movement by making another resistance on the downtrend line in the future. The CCL stock is not suitable for any time frame, be it a yearly, monthly, weekly, or daily time frame.
Summary
The CCL stock is in a downtrend position in the yearly, monthly, and weekly time frame. It is not a good choice to invest in positional or swing trading. However, in the daily time frame, it is in a sideways position. It is not a good stock for short selling as it cannot give a good return on investment to the traders in intraday.
Levels
Resistance Level: 10.85 GBP and 8.93 GBP
Support Level: 6.85 GBP and 6.16 GBP
Disclaimer
The analysis is done for providing information through technical analysis and no investment suggestions are given in the article to be made by investors.


