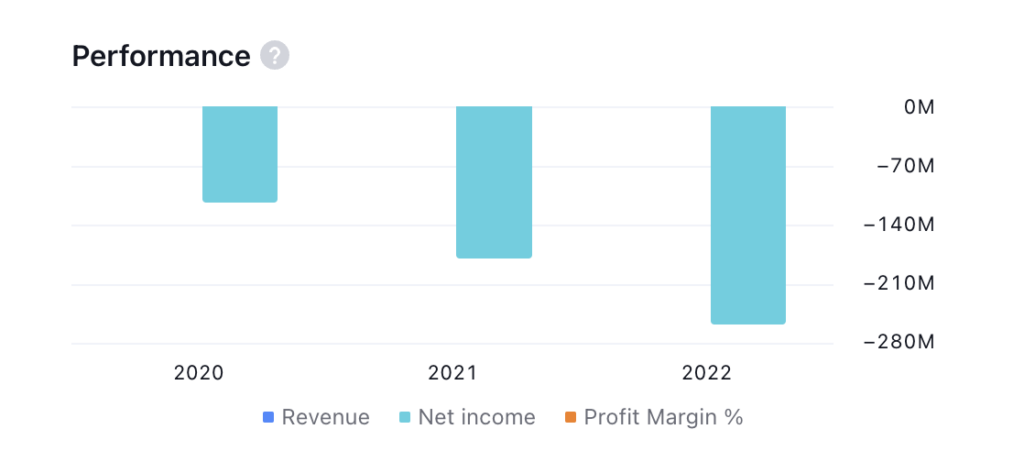
- Joby Aviation’s actual earnings are less than the expected earnings.
- The company’s net income is negative, i.e., around -$258 million.
- The technical indicator summary provides a ‘sell’ recommendation for JOBY stock.
Joby Aviation (NYSE: JOBY) is a transportation enterprise dedicated to the development of an electric vertical take-off and landing aircraft. The company’s goal is to operate this aircraft for commercial passenger transportation starting in 2024.
JOBY stock is currently exhibiting a downtrend, characterized by the price forming a pattern of lower lows.
After reaching a peak at $11.98, the stock faced a 49% decline but managed to find support at the $6 level. Currently, it’s forming a new pattern of lower lows, indicating a weak structure on the weekly chart and suggesting a potential for further decline in the near future.

Over the past three months, JOBY stock has given a return of nearly -40%, highlighting a weak performance during this period. Additionally, the company has a debt of -$27 Million and a free cash flow of -$290 Million. This shows that Joby Aviation does not have enough cash flow to meet the debt obligation, reflecting the poor financial performance of the company.
Furthermore, the company’s actual earnings have fallen short of the expected earnings by -193%, underscoring the financial difficulties it faces.
Moving on to the technical analysis, the indicators lean heavily towards a ‘sell’ signal for JOBY stock. Out of 26 indicators, a majority favour a selling position, with only a few offering neutral signals. The moving averages summary also strongly recommends selling the stock, reinforcing the idea of a clear downtrend.
Joby Aviation (JOBY) Stock Price Analysis
JOBY by writer50_tcr on TradingView.com
Technical Indicators:
Upon evaluating JOBY stock’s technical indicators, it’s evident that both the MACD and signal lines are below the zero line. Additionally, a red histogram emphasizes the stock’s strong downtrend, implying a potential further decline in the coming days.
In terms of the RSI line and the 14-day SMA line, they both hover around the 40 level, signifying a negative zone. This configuration suggests that the price will likely experience continued declines in the future.
Conclusion
In conclusion, the JOBY stock price is currently exhibiting signs of a downtrend. The price has given a negative return in the previous months along with the negative price structure. The indicators are also revealing a negative signal and the company’s earnings are negative. Thus, considering these factors it can be concluded that the price is likely to fall further.
Technical Levels
- Support Level– $5.8
- Resistance Level– $6.7.
Disclaimer
The views and opinions of the author, or anyone named in this article, are for informational purposes only. They do not offer financial, investment, or other advice. Investing or trading crypto assets involves the risk of financial loss.


