- IMC coin price has declined over 88.55% from the highs it created soon after the listing.
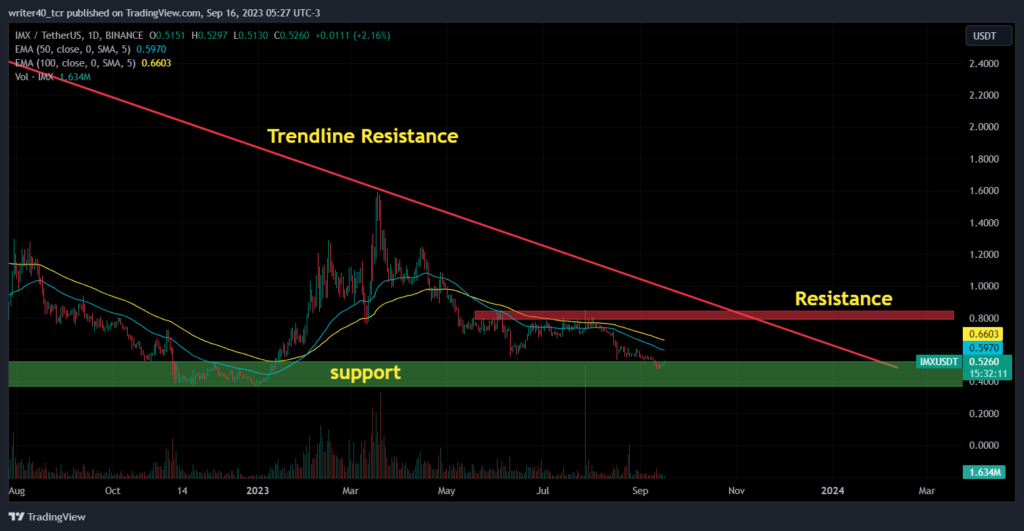
- IMC price has formed a descending triangle pattern on the daily time frame and is trading at support levels.
- IMC price has declined by 3.01% in a week, 17.15% in a month and 34.15 % in a year.
Market capital of Immutable Coin – $615.18 million
The current market price of Immutable coin – $0.5282
IMC price is trading in a positive trajectory today as the current price is up by $0.0097(1.92%). The price is surging for the 4th straight session and till now it has surged about 10% in 4 days which shows that the buyers are trying to rebound the price from this level. The price is now heading towards the previous support level of $0.5363
IMC coin has declined sharply after the listing as the stock eroded over 89% from the highs. The sharp decline formed a very bearish chart structure for this crypto. The coin has declined over 3.01% in a week, 17.15% in a month and 34.15% in a year indicating that the price is in a strong downtrend.
The price has formed a descending triangle pattern on the daily time frame and is currently trading at the bottom of this pattern which is also a support zone for the price. The price is trading below both the important EMAs i.e. 50 and 100 which are currently placed near $0.5976 and $0.6604 levels.
Technical analysis of IMX coin

As we already discussed the price has formed a descending triangle pattern where the trendline resistance is present near $0.96 and the price has formed one resistance near the $0.80-$0.84 level. If we talk about the support zone then the price has previously formed a base in between $0.38- $0.50 levels and currently respecting that zone as a support.
If we observe the volume profile the stock has witnessed a large volume candle at the top of the nearest resistance level and the price reacted well from that level and declined sharply. Now the price is witnessing some volume spike at bottom levels which can lift the price from these levels in the near time.
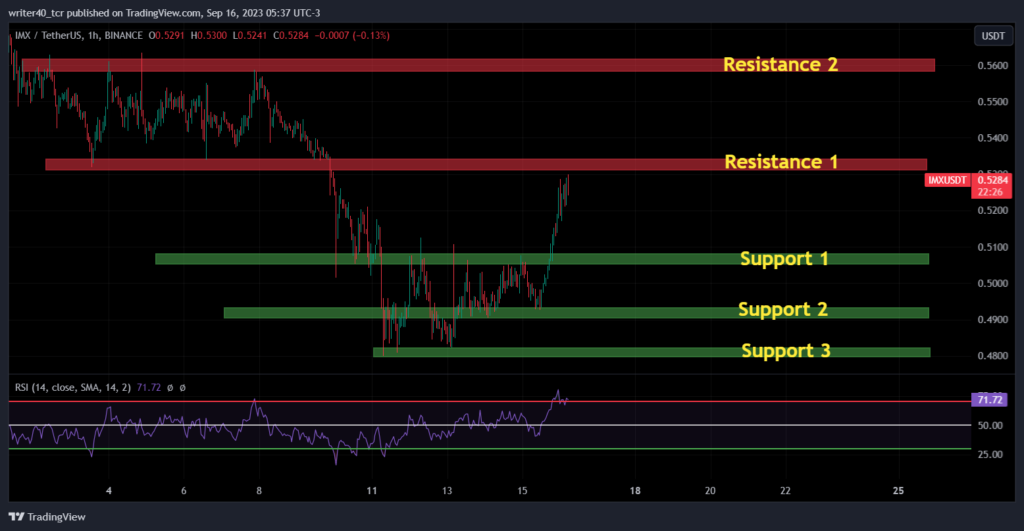
On the hourly time frame, the price has recently broken the resistance level which can act as support now and is drawn as Support 1 on the chart. The price has formed the base at the bottom and from there, it consolidated between support 1 and support 3 and just before the breakout it created a support which is drawn as Support 2.
The important levels to watch out for on the upper side are $0.5308-$0.5342 i.e. Resistance 1.
The next major and crucial resistance level is placed near the area of $0.5586 and $0.5620 which is marked as Resistance 2 on the chart. On the support side, the first support is placed near $0.5050 and 0.5080 and the second support is present near $0.4905-$0.4935.
The crucial support zone is near $0.5585- $0.5615, where the price has formed the base previously is very important for the bulls. The Relative Strength Index is currently at 70.78 on hourly time which indicates that the price is now at the overbought zone and can feel some selling pressure from this level.
Conclusion
The price on the hourly chart has formed a base near the previous support level on the daily chart which indicates that the bulls are finding their way to move the price up. Although the RSI indicates that the price is overbought, we can see some mild correction or consolidation before the breakout.
Technical Level
- Resistance – $0.5310 – $0.5343
- Support- $0.5050- $0.5090
Disclaimer
The analysis is done for providing information through technical analysis and no investment suggestions are given in the article to be made by investors. The coins are unpredictable so investors should have proper knowledge. Cryptocurrencies are highly volatile and risky. Investment should be made with proper technical analysis.


