- Shiba Inu price prediction displays the bearish sentiment of the market since February 2023
- SHIB price reported a loss of 34.70% in the last one year.
- Shiba Inu price made a bullish recovery of 45% from its crucial support of $0.00000562
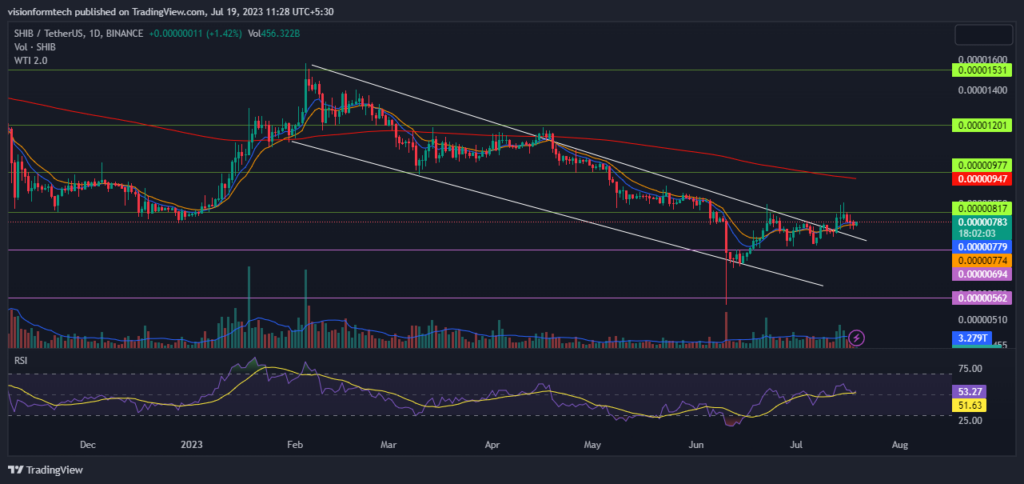
Shiba Inu’s (SHIB) price prediction uncovers the bearish dominance of the SHIB token, which started declining in February 2023. The SHIB crypto witnessed a pump of 96% from its swing low to the resistance price of $0.000015311. The market started to weaken, and the bears took control, pushing the price down by 62.70 dollars to the most critical support of $0.00000562. It was followed by a swift recovery of 45% to its current market price.
At the time of writing, the current market price of SHIB tokens is $0.00000783 The 24-hour trading volume plunged 16.95%. The market is up 1.30% in the last 24 hours. The overall market cap of Shiba Inu is $4,612,733,523.
Can SHIB Price Reach The Target of $0.00001531?

Source: SHIB/USDT 1D Chart by TradingView
Shiba Inu’s (SHIB) price prediction unwinds the development of a descending channel pattern as the price moves down. After getting rejected at the resistance, the price started developing a bearish market structure. The SHIB crypto price tumbled, breaking various support levels before hitting the lows.
However, the bulls came to the rescue at $0.00000562 and decided to buy the dip, allowing the SHIB token price to breach the resistance of $0.00000694. At present, the SHIB price is escaping the descending channel pattern, but it lacks strong volume. If the bulls break the resistance of $0.00000817 with volume, it may ignite a bullish reversal.
Will Shiba Inu (SHIB) Maintain its Bullish Momentum?

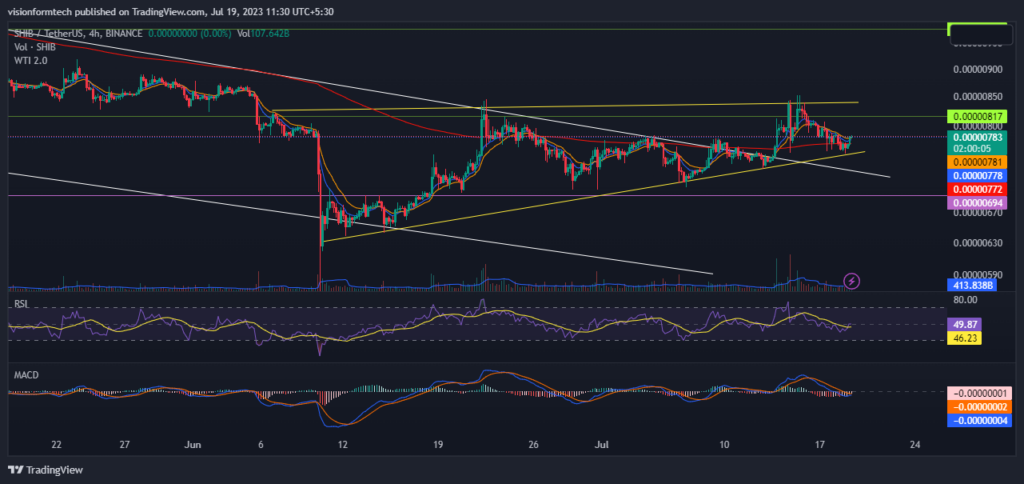
Source: SHIB/USDT by TradingView
The 4-hour chart indicates that the SHIB coin price is in a short-term uptrend. This can be concluded by the price action, which printed a series of higher highs and higher lows. The price moves up while bouncing off an ascending trendline, which is a significant support in the short term. So far, the SHIB token has made two attempts to break the resistance but has faced rejection.
The price must break the resistance to sustain the recovery phase and reach the upper levels. It’s important to keep an eye on the trendline. If the SHIB price breaks below it, it will trigger panic selling, flushing the price to dangerous levels. Meanwhile, the price is trading above the 200 EMA, which acts as significant support.
RSI: The RSI indicator is currently at 49.42. It represents bearish conditions where the price may continue to fall until RSI crosses above 50. Aggressive sell-off may happen only if RSI goes below 30
MACD: MACD made a bearish crossover and the indicator has crossed below the 0 line. However, the MACD and the signal are about to make a bearish crossover soon. It means the correction may be over soon and the price may continue moving up
200 EMA: On the 4-hour chart, the price is trading above the 200 EMA. This is a bullish sign and an indication that the buyers are in control. The 200 EMA acts as a dynamic support, and the prices may continue increasing until the price breaks below the indicator.
Conclusion
Shiba Inu’s (SHIB) price prediction uncovers the bearish dominance of the SHIB token, which started declining in February 2023. The recent price action raises hope for investors in the short term. However, the overall trend still remains bearish, and it would be wise to wait for the breakout of the resistance. Moreover, Investors are advised to exercise caution while following a proper risk management strategy to avoid big losses.
Technical Levels
- The nearest support level: $0.00000694
- The nearest resistance level: $0.00000817
Disclaimer
The views and opinions stated by the author, or any people named in this article, are for informational purposes only and do not establish financial, investment, or other advice. Investing in or trading crypto assets comes with a risk of financial loss.


