

- NEAR is indicating a bearish trend both in long-term and short-term.
- It is currently trading at $1.15 with an intraday fall of 1.2%.
- The token is down by 94.35% from it’s all-time high.
NEAR has been a downtrend for a very long term. Recently, It broke its long term support of $1.2 which is now acting as a resistance for the price. The token is currently trading with a volume surge of 35% in the last 24 hours.
Near marked its all-time high on 17th Jan 2022 where the price of the token was $20.42.
- The token has a circulating supply of 94.16 million tokens currently circulating in the market.
- The token has a market cap of $1.08B.
- The 24-hour trading volume of the token is $4.29M.
The Token has some major events this year :
- 8th Sept 2023 to 12th Sept 2023 – NEAR APAC
- 7th Nov 2023 – NEARCON 2023
SENTIMENT ANALYSIS :
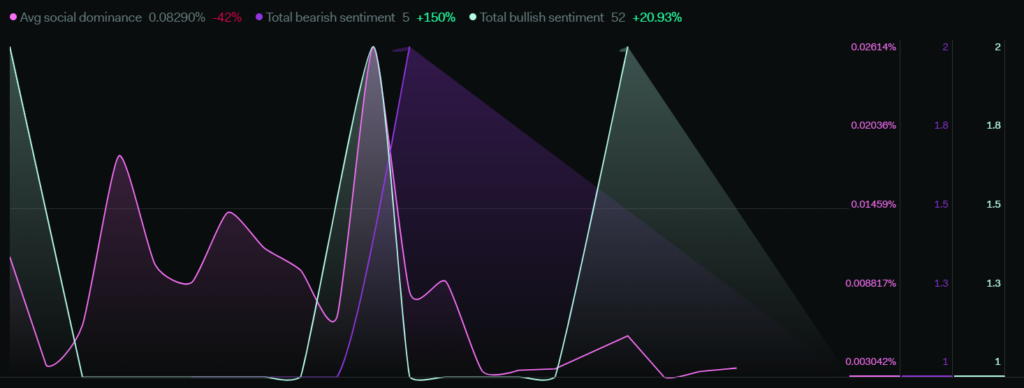
The average social dominance has been declined by 42% as its community is not active and engaging. The bearish sentiment has increased by 150% as the token broke its last long term support and is currently trading below it. The bullish sentiments have an increase of 20% but the bearish sentiments are still dominating the overall sentiments.
The overall sentiments are indicating a bearish trend.
TECHNICAL ANALYSIS ( DAILY – 1D )
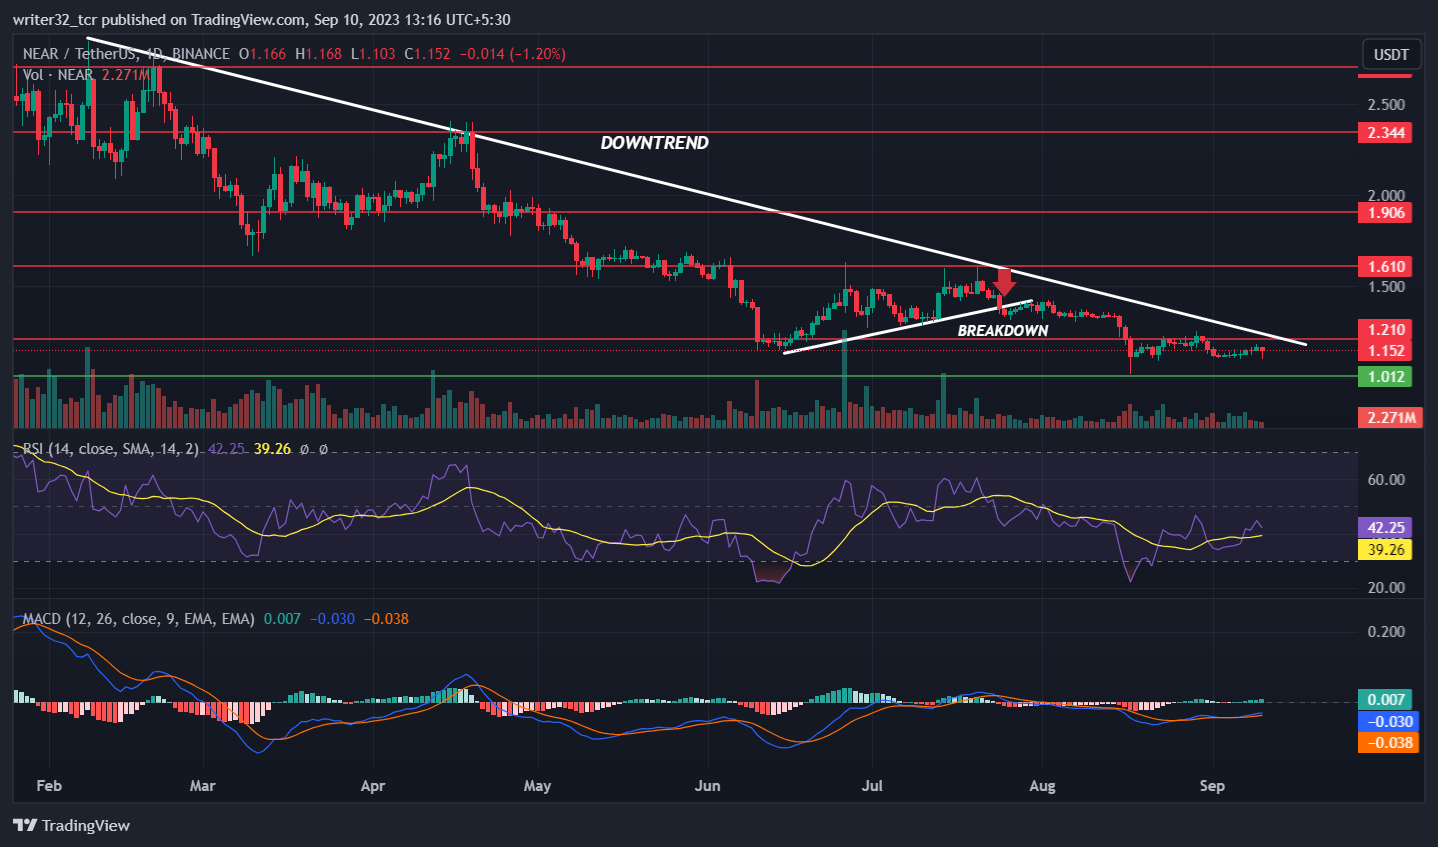
As we can see in the chart, the token has been in a downtrend for a very long time and the token also started to move on a trendline but got a rejection from the $1.6 resistance and broke the trendline below has also recently also broken its historic support of $1.2. The token is currently trading below the $1.2 resistance which was before a support.
The token seems to be bearish as now signs of bullishness can be seen in the token in the short-term time frame.
The token can go to the level of $1 support and may bounce from that level and if it breaks the $1.2 resistance then it will regain that level as a support again.
If the token gets rejected from the $1.2 resistance then we can see a further downfall in the price of the token and we can fall to $0.5 range.
The RSI is below the neutral level 50 as the RSI is moving at 42.25 points and the SMA 14 is at 39.26 points. The RSI is indicating that the token is currently under oversold region. The RSI is showing a bearish trend.
In MACD, The fast blue line is moving above the red slow line showing a bullish side and the increased volume can be seen in the histogram. But, < The RSI is still bearish.
If the token has to reach $3 this year then, the token has to regain its $1.2 support and also the community of the token has to come stronger and the bulls of the market have to be dominating the market. There are 4 major resistance levels to reach the $3 mark. The break of $2.7 will confirm the $3 this year.
CONCLUSION :
The token is currently under a downtrend and is not showing any signs of the bullish move anytime soon. The token is likely to take support from the $1 and if it breaks the $1.2 resistance then we can be a little on the bullish side until then the token is considered to be in the bearish trend.
The tokens can be accumulated between $1 and $1.2 for the spot entries.
TECHNICAL LEVELS :
SUPPORT : $1
RESISTANCE : $1.2, $1.6, $1.9, $2.3 AND $2.7.
Disclaimer
The views and opinions stated by the author, or any people named in this article, are for informational purposes only and do not establish financial, investment, or other advice. Investing in or trading crypto assets comes with a risk of financial loss.


