

- SFP Coin Price has continued trading in an uptrend since June 2023.
- The SFP coin price sustained above the 20-day EMA after the breakout of the falling wedge pattern.
- The next SFP coin bullish rally will surge up to the $0.68 level after the price correction.
SafePal coin has continued trending in an upward direction since June 2023. In the last 3 months’ trading sessions, the coin price has gained almost 67%. Since then the coin price never broke its support levels and continued performing in an uptrend.
After the breakout of the falling wedge pattern, the SafePal coin price gained almost 37%. It continues getting rejected from the 20-day EMA, which started on 8 Aug 2023.
Since the breakout of the pattern, the SFP coin made 2 impulsive moves and the last impulsive move made the $0.68 level resistance. The next rally will probably break that level after taking the bullish correction at the $0.53 level.
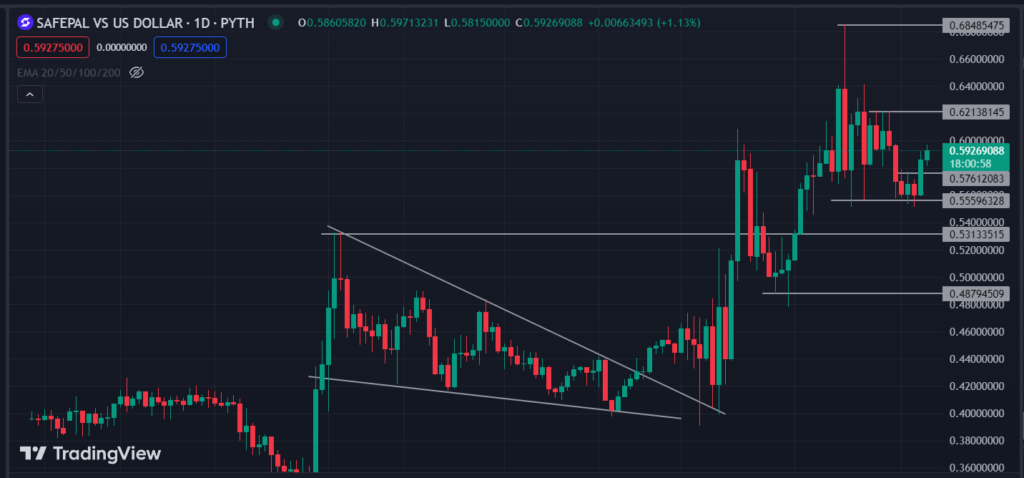
The $0.40 has become the key price level for the bullish impulsive rally. After getting rejected several times, the coin price surged impulsively, and the 2nd rally started from the $0.48 level. It continued its momentum until it reached the $0.68 level and became the major resistance level. The 3rd impulsion will probably break the previous resistance if the price takes a decent correction.
Is SFP Making Head And Shoulders Pattern?
In this chart, the coin price is more likely to form a head and shoulders reversal pattern. The pattern is half formed by the left shoulder and the head. However, after getting this type of bullish impulsive move from previous support levels, there is a very low possibility that the price would form a right shoulder.
The coin price needs to be slightly down to get a proper correction between the $0.53 to $0.55 levels.
Will the SFP Coin Retest The $0.53 Level?
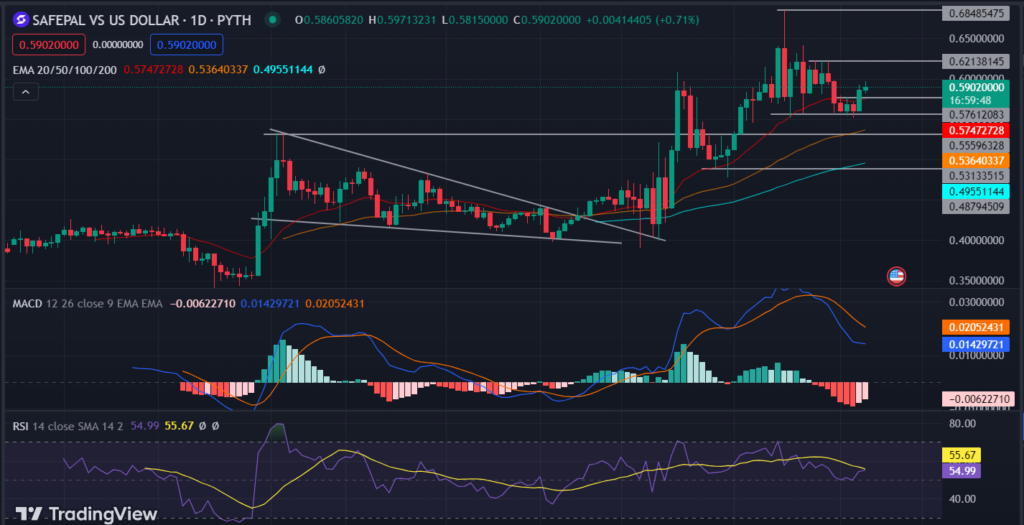
The technical analysis shows that the current Coin price is trading at the $0.59 level, above the three major EMAs: 20, 50, and 100-day EMAs. The coin price is closer to 20-day EMA as compared to 50 and 100-day. This indicates the price is in a strong uptrend. The MACD also shows more volume toward the bullish side rather than the bearish with the help of its signal lines that too are tangling over the bullish side.
Lastly, the Relative strength index (RSI) indicates the price strength took correction at the 50.00 middle band and turned upward. It shows the range between $0.55 to $0.53 level is the strong support.
Technical Levels
- Resistance Levels: $0.62 and $0.68
- Support Levels: $0.55 and $0.53
Disclaimer
The views and opinions stated by the author, or any people named in this article, are for informational purposes only. They do not establish financial, investment or any other kind of advice. Investing in or trading crypto assets comes with financial loss.


