

- Solana price prediction points at the recent bullish price action for the SOL Token
- SOL price recorded a year-to-date growth of 154.46%.
- Solana price broke the resistance of $26 while trying for a bounce at the retest.
Solana’s (SOL) price prediction focuses on the sideways price action that succeeded in the bullish recovery at the start of the year 2023. The SOL price made a bullish recovery of 226% from its swing low to the resistance of $26. Since then, the market has been trapped between the resistance and local support of $16. Recently, the price made a bullish attempt to break the resistance.
At the time of writing, the current market price of SOL tokens is $25.28. The 24-hour trading volume surged 17.93%. The market is down 6.24% in the last 24 hours. The overall market cap of Solana is $10,723,272,778.
Can SOL Sustain the Bullish Momentum?
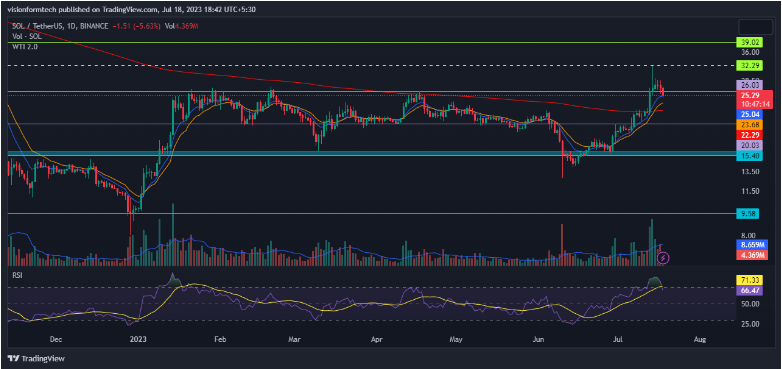
Solana’s (SOL) price prediction reveals the sideways movement of the market since February 2023. In this consolidation phase, the SOL token price bounced twice from support. The price did make multiple attempts to pierce through the resistance but hasn’t been able to sustain above it.
Looking at the recent effort, the SOL crypto price dipped below the support, reaching a low of $12.98. Although the price breached the support, the bulls bought the dip aggressively, trapping the sellers, and the SOL coin started recovering. This led to a massive surge of 140%, and the price peaked at $32.29 before the correction. The recent price action pushed the price above the 200 EMA, which is a buy signal.
Will Solana (SOL) Confirm the Breakout of the Resistance?
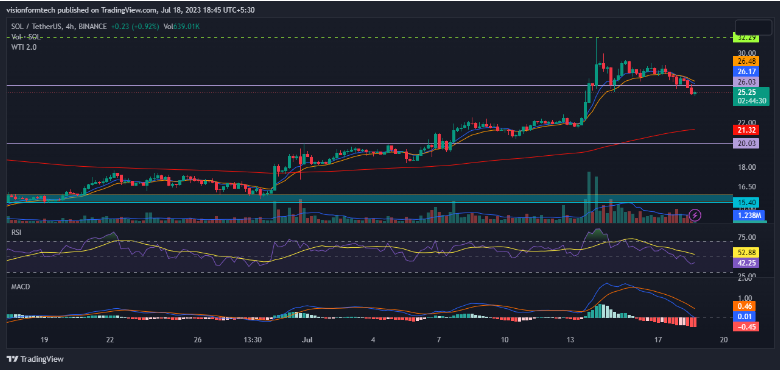
The 4-chart reveals a bullish market structure represented by the formation of higher highs with higher lows. The SOL price is trading above the 200 EMA which signifies the buying strength. The SOL token price has made a correction of 21.82% from its recent swing high.
The correction has pushed the price below $26, which should have been the support after the breakout. The price was supposed to retest here and continue its leg up. Instead, the SOL price has fallen below it, increasing the chance of a reversal to the lower levels. The local resistance of $22 should be the last hope for the bulls. If the price continues the bullish momentum, expect SOL Crypto to reach $50 in the future. The 4-chart reveals a bullish market structure, represented by the formation of higher highs with higher lows. The SOL price is trading above the 200 EMA, which signifies buying strength. The SOL token price has made a correction of 21.82% from its recent swing high.
The correction has pushed the price below $26, which should have been the support after the breakout. The price was supposed to retest here and continue its leg up. Instead, the SOL price has fallen below it, increasing the chance of a reversal to the lower levels. The local resistance of $22 should be the last hope for the bulls. If the price continues its bullish momentum, expect SOL Crypto to reach $50 in the future.
RSI: The RSI indicator is currently at 42.33. It represents bearish conditions where the price may continue to fall until RSI crosses above 50. Aggressive sell-off may happen only if RSI goes below 30
MACD: MACD made a bearish crossover. The Indicator is slowly making its way below the 0 line. This hints at a bearish momentum in the short term until the MACD makes a bullish crossover.
200 EMA: On the 4-hour chart, the price is trading above the 200 EMA. This is a bullish sign and an indication that the buyers are in control. The 200 EMA acts as a dynamic support, and the prices may continue increasing until the price breaks below the indicator.
Conclusion:
Solana’s (SOL) price prediction focuses on the sideways price action that succeeded in the bullish recovery at the start of the year 2023. The market has traded with bullish sentiment in the past few weeks. However, the market structure is suggesting a reversal from the resistance, as the SOL price is sliding below it. If the price bounces from here, the bulls may drive the prices to higher levels. Until then, it would be wise to practice proper risk management.
Technical Levels
- The nearest support level: $22
- The nearest resistance level: $30
Disclaimer:
The views and opinions stated by the author, or any people named in this article, are for informational purposes only and do not establish financial, investment, or other advice. Investing in or trading crypto assets comes with a risk of financial loss.


 price prediction focuses on the sideways price action that succeeded in the bullish recovery at the start of the year 2023.)