

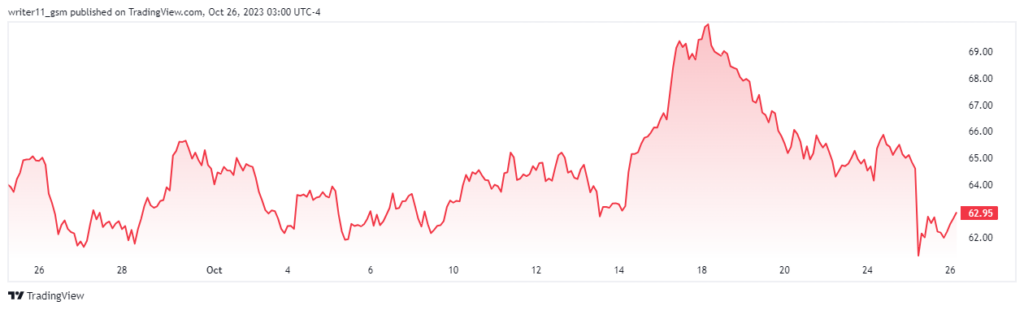
- Due to the huge gap, ETSY stock ended with a decline of 2.52% in the last trading session.
- The trading price of the ETSY stock is $62.96 and it operates in the retail trade business.
Etsy Inc. is an E-commerce company founded in America. It generally focuses on handmade or vintage items and handcraft supplies. Etsy has a website where they sell various kinds of products and vintage products that are at least 20 years old. Etsy Inc. has its headquarters in Brooklyn and the founder of the company is Robert Kalin, Chris Maguire, Haim Schoppik, and Jared Tarbell.
The market cap of the ETSY stock has declined to $7.745B with the decline in the share price. The EPS for the company is negative to -5.65 USD which denotes that the company is making a loss on each share.
Currently, a beta of the ESTY share is 1.99 which makes the share price returns more volatile than the average of the market. The debt/equity ratio of the company was very bad resulting in -514.67%. This indicates that the management of the debt of the company is very poor.
Financial Performance For ETSY Stock
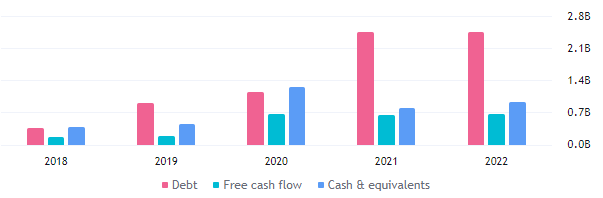
The debt of the company is certainly very high compared to the revenue of the company for the years 2021 and 2022. The reported debt by Etsy Inc. for the year 2022 is $2.43B and the reported revenue at the same time is $2.57B. Also, the net profit margin of the company is negative resulting in a net income of -$694.29M.
Will ETSY Stock Rebound To The Historical Levels And Hit The Mark Of $100?
The share price of ETSY was consistently following an uptrend before November 2021 and hit a high level of $307.75. Since then the stock started to decline making lower low swings. Since then the trend of the stock has been completely dominated by sellers and the price declined by 75%.
Looking at the most recent price action of the share price we can see that the ETSY share price is taking support at the previous swing low. If the price breaks above the previous swing high it might lead to a trend change to bullish. This can lead the price of the stock to further highs.
The EMAs and the RSI are indicating a sell signal on the downtrend as the existing trend has been strongly bearish. The ESTY share price is currently trading below the 50-day and the 200-day EMA. The RSI also tried to sustain above the 50 levels but failed and is currently trading at a level of 42.30.
Conclusion
As the financials of the company are weak and the debt is high, the current position of the company does not seem to be reliable for future performance. Despite this, the stock price of ETSY is currently taking support at the previous swing low. If the share price sustains at the level and breaks above the $71.00 mark. The share price can lead to further new highs leading to an uptrend.
Technical Levels
- Support levels– $52.00 and $63.00
- Resistance levels– $75.00 and $102.00
Disclaimer
The information provided in this article, including the views and opinions expressed by the author or any individuals mentioned, is intended for informational purposes only. It is important to note that the article does not provide financial or investment advice. Investing or trading in cryptocurrency assets carries inherent risks and can result in financial loss.


